


.png)
IT career tips
Sign up for our newsletter to get future-proof advice from tech industry experts.

TechStart podcast
Explore the realities of changing careers and getting into tech.
By Nate Christenson, TripleTen Data Scientist program graduate
If you want to improve your SQL skills, as with all aspects of life, the best way to get better is through hard practice. A good place to start practicing is through analyzing time-series data, which is one of the more prevalent types of data you will encounter.

We will perform some basic operations on a hypothetical dataset to demonstrate how this data can be analyzed. See the below table as an example to understand the fields.

Some of the basic strategies that we will review are:
- Grouping by timestamp and other fields to find patterns
- Checking for patterns in datasets using ‘group by’ for timestamp
- How to work with Unix timestamps and convert from UTC
- Checking for rolling averages and cumulative totals
- Techniques for handling missing data
Group by Timestamp
If the data in our dataset is not expected to have an entry for every timestamp, grouping by timestamp can help view patterns by time of day. For example, this type of analysis can quickly reveal the time of day with the most sales or reveal what time of day has the most frequent transactions.
Assuming that metric1 from our above dataset describes sales, the following analysis can reveal which hour of the day had the most total sales revenue on July 25th:

You can take the results from this query and place them into an excel file to get a quick graph of the total sales on July 25th.
Tips:
- If you do not order your data by timestamp, the return from your query will be random, and graphing this data will be nonsensical. Because this is a ‘quick and easy’ line in your query, it can often be forgotten.
- When you are grouping by a metric, it is usually beneficial to include that metric as a standalone in your ‘select’ statement. In this example, we are grouping by timestamp to get the sum of sales from metric1, but without the addition of timestamp in our query, we will not know what time interval is represented by each row in our return.
- This type of method can be used to group by higher level areas of a timestamp such as day or month using date() or hour() SQL methods.
- E.g., select select date(timestamp)... group by date(timestamp)
Grouping with Multiple Fields
If you want to analyze how specific columns of your dataset perform across a time range, you can group by multiple fields. In the previous query, we searched for the performance of sales for all items across July 25th, but what if we wanted to analyze sales for each individual item? We add that column to the ‘group by’ statement!
Following from the previous query, all we have to add to divide sales across the day is the ‘item’ column to the ‘group by’, ‘select’, and ‘order by’ statements.

In this example, we grouped by item and timestamp. This will get us the sum of each item’s sales across each hour.
This type of analysis can help you determine different patterns of sales for different items.
Use convert_timezone for UTC Timestamps
Most datasets use the UTC time zone for storage. If you want to analyze data or share an SQL statement with a colleague, converting the query to your local time zone can make your query results easier for others to understand.
In the previous query examples, we have been querying for July 25th at midnight UTC to July 26th at midnight UTC. If you are in the US, this will not exactly translate to a common ‘day’ interval. 00:00 UTC is actually 8 p.m. the previous day in east coast time.
A great way to make your query easy to share with colleagues is to use a method that converts the time zone.
This following example shows how to use the convert_timezone method for data that is stored in UTC time.
* Note: convert_timezone is a method specific to AWS Redshift, which is a data warehouse solution. If you are using a different data platform, you may need to use a different method such as TODATETIMEOFFSET, which is another common method that should be supported on most SQL servers.

How to Work with Unix Timestamps
Data is often stored in Unix time instead of a regular timestamp. Your database may even be storing this as an int data type and not a timestamp. Unix timestamps are hard to interpret, so to support any level of time-based querying or analysis, you need your query to transform the data. Before doing this, you will not be able to have a ‘where’ statement that uses timestamps or have any results that are legible.
What is a Unix timestamp?
A Unix timestamp is a point in time that is measured in the number of seconds/milliseconds from UTC 00:00:00.000 on January 1st, 1970.
Fun side note: There was speculation that this data storage type could lead to a y2k digital collapse, when the number of integers reaches the 32-bit limit on January 19th, 2038. However, this is unlikely to cause the apocalypse, because most Linux implementations should be updated to 64 bit or further by then.
This is slightly more complicated than the previous queries, but the concepts are still straightforward. For the purpose of this query, we will assume that the column ‘timestamp’ from our data set is stored in Unix values

This query should function in the same manner as the query before where we grouped by multiple fields, except that we had to convert the timestamp into a legible value.
Note that there are several steps in this query line:
1. Cast the original value in the timestamp into a big integer value.
1.1. CAST(timestamp as bigint)
1.2. This first step may not be required for all scenarios. This example is coming from a project where the data was stored in a Glue database for an IOT project where devices were storing data in S3 buckets. This type of storage required additional data transformation that may not be necessary for everyone.
2. Then from the big integer, use FROM_UNIXTIME to convert our unix timestamps into legible time values.
2.1. FROM_UNIXTIME(CAST(timestamp as bigint)) as interval_start
2.2. We need to add a set of parentheses around the CAST, and that will extract the Unix time value from our field.
In this query example, the big integer values were still used in the ‘where’ condition. In order to determine what values to use in this type of scenario, this epoch converter tool is especially useful.
Check for Rolling Averages
If our dataset from MyTable has data from multiple months, we may want to find the moving five-day average to remove confounding ‘noise’ from individual days and identify the overall sales revenue direction.
Rolling averages, also known as moving averages, are used to smooth out short-term fluctuations and highlight long-term trends. By averaging data over specific periods, they can help identify more general patterns. A prime example of this is weather trends. Day to day, temperatures can be erratic, but general trends emerge when temperatures are averaged out over individual weeks.
In any case, let's dive into how you can compute a five-day rolling average using SQL.
To do this, we can utilize a combination of the SUM function and the JOIN clause. We'll sum the values of the five days including the current day and divide it by five.
Here's a basic example to compute a five-day rolling average for metric1:

In this example, we are using a ‘self join’ to compare MyTable against itself. This ‘datediff’ in the ‘join’ statement is pulling other entries from MyTable that are 1-4 days away from each entry in MyTable, and the AVG in the select part of the query is getting the average of those comparisons.
Techniques for Handling Missing Data
Another critical aspect to consider when working with time-series data is the handling of missing data. If you're calculating a rolling average and some days are missing, it can skew your results.
There are a few techniques you can use:
- Forward Filling
- Forward filling involves filling missing values with the last observed value.
Here is an example of how to forward fill with our MyTable dataset, assuming there are missing values in the ‘metric1’ column.
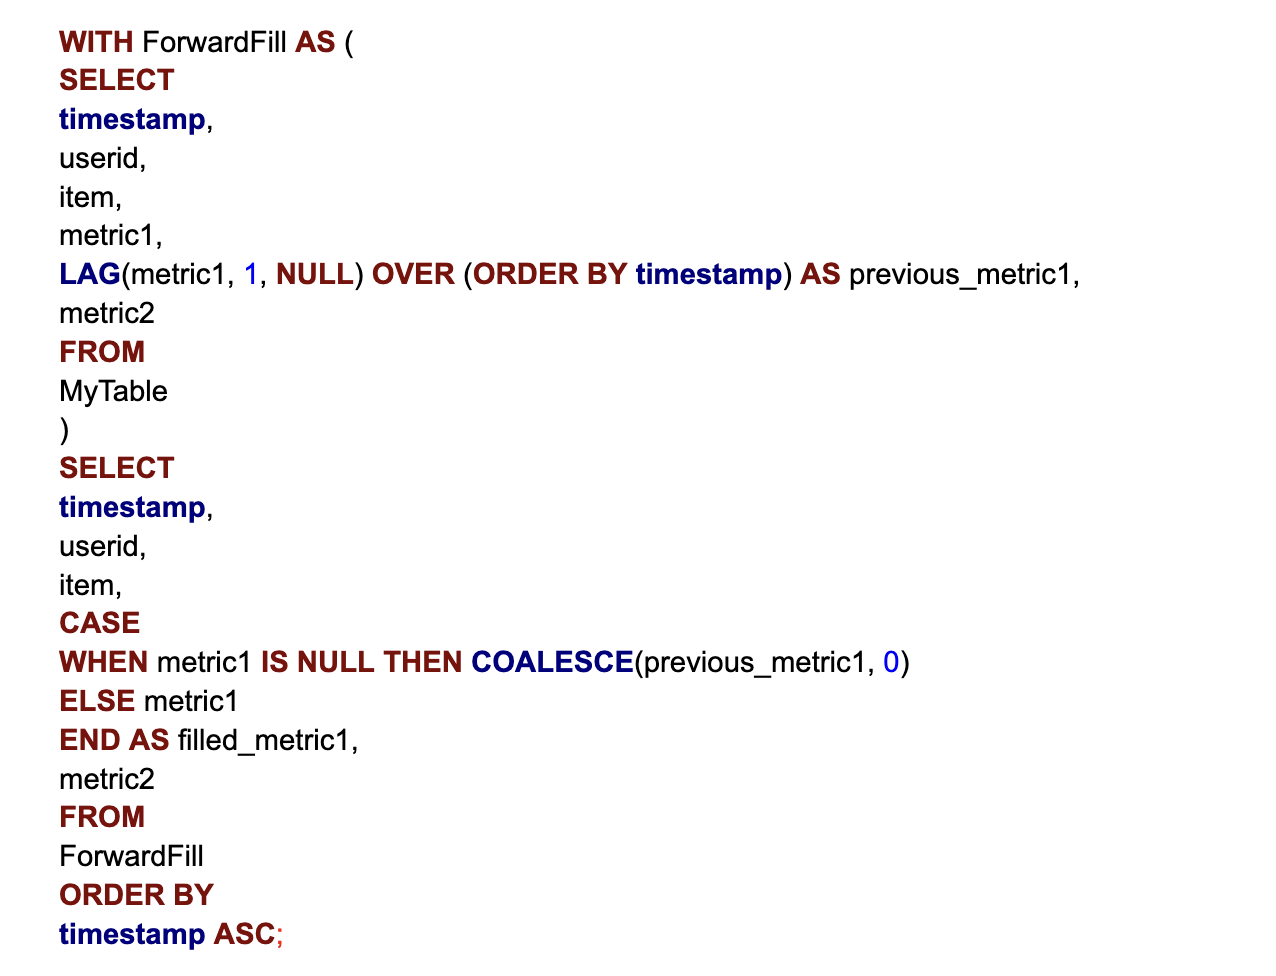
This query starts with a common table expression (CTE) and then references that in a CASE WHEN conditional in the select. It tells the query to fill the metric when the previous metric has a null value.
Backward Filling
This is the opposite of forward filling. The main difference is that it fills missing values with the next observed value instead of the previous.
To write a query for this, the main difference would be to change LAG(metric1) to LEAD(metric1).
Replace Missing Values
To replace a value, we need to use the COASLESCE function. This works in SQL very similarly to fillna() in Pandas.
Here is an example of how to replace any missing values in metric1 with 0.

In this example, we are returning all the values of metric1, and if there are any missing values, it will fill them with 0. We can replace the ‘0’ in the above query with any other value desired.
Final Thoughts
Working with time-series data in SQL can initially seem daunting due to the variety of transformations and analysis techniques available. If you can continue to practice, you can unlock deep insights from your data and continue to improve your abilities using SQL methods.
TripleTen’s free online SQL course can help you get more experience and level up. This will help you get the basics down and be more prepared for what is ahead.
IT career tips
Sign up for our newsletter to get future-proof advice from tech industry experts.
TechStart podcast
Explore the realities of changing careers and getting into tech.


.png)


