


TechStart podcast
Explore the realities of changing careers and getting into tech.

.png)
IT career tips
Sign up for our newsletter to get future-proof advice from tech industry experts.
You probably know by now that companies collect data about users’ every action — even on another app or website. For example, Netflix knows which movies the user prefers, what genres they don’t watch too much of, and which ones they might want to watch in the future. Meta or TikTok, meanwhile, are aware of the user’s age, exact location, phone contacts, and even payment data.
Imagine how much data every company collects! And the volume of data created increases every second.
However, collected data alone doesn’t tell you anything. To offer users something they can’t refuse — and extract more profit — companies have to analyze this data.
Excel is usually the first thing we imagine used for such a purpose. But there’s so much data that Excel cannot handle all of it. What would happen if a small child were to try and lift a 100-pound weight? Nothing good. It’s the same with Excel in relation to more complex programming requirements and a staggering amount of data.
This is where Pandas, the Python library, comes in. It’s just like Excel, but is able to breeze through millions of data rows without breaking a sweat.
What is Pandas?
Any programming language has libraries. The library helps to not reinvent the bicycle whenever someone goes to the bakery. People just take any bicycle and ride it. The same goes for coding.
The developer does not think about how the software works or how to transfer data to the server. They open the library, write a few lines of code, and get the desired result.
It’s very difficult to do this from scratch. So any library in the IT world is a set of ready-made functions, classes and objects, designed to solve specific tasks — for instance, in software development.
Python is no exception. It also has libraries. Pandas is one of them. It helps to process the data.
As you might have guessed, Pandas has nothing to do with the furry animal. The name of the library comes from “panel data”. Panel data is any information that we obtain through research and then structure in a spreadsheet. Pandas was created to handle such datasets and make life easier for the data analyst.
For example, before analyzing data, the analyst needs to read that data from a file. Without Pandas, the file data will stick together. A big “blanket” of data does not make any sense.
Next step: a data analyst should decide how to store the data from a file, open it, and separate the sticky parts. (Sounds scary, doesn't it?)
In Pandas, it’s simpler. All you have to do is write a single line of code:
> data = pd.read_csv ('file.csv')
The library will then open the desired file and sort the data.
Other libraries work similarly. Pandas makes data analysis easier and much faster.

To be precise, it splits the sticky data into a DataFrame.
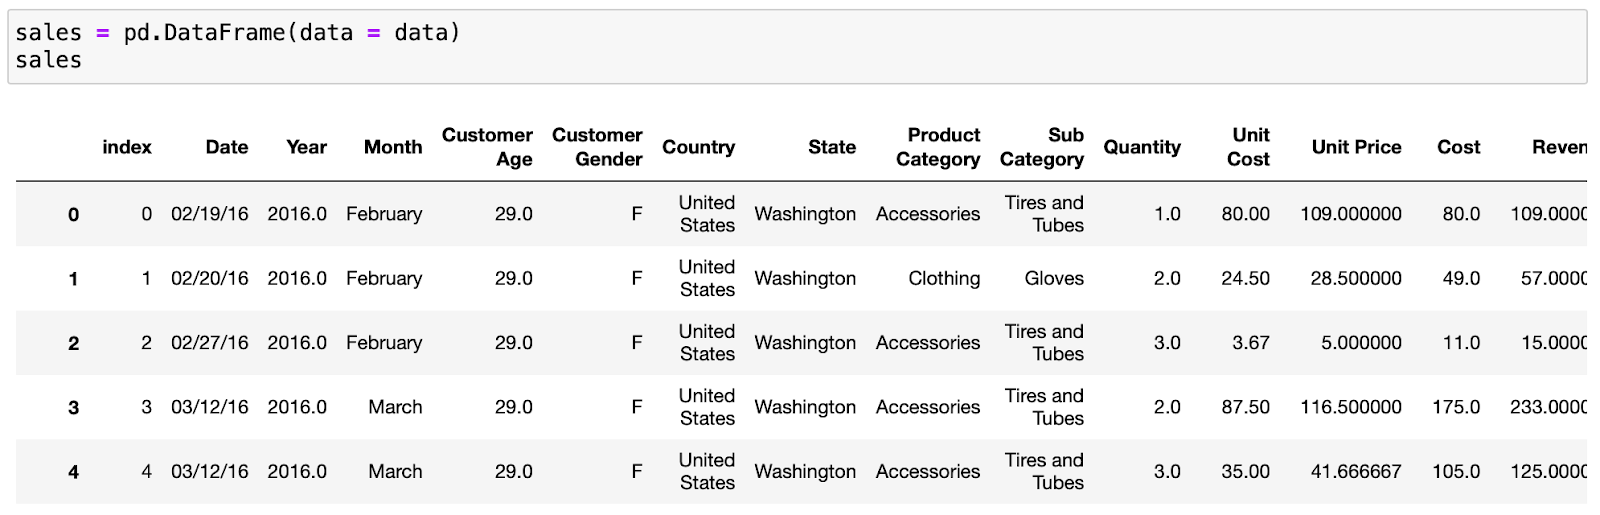
A DataFrame is a spreadsheet that has rows, columns, and cells like any spreadsheet. So the data in a DataFrame is more visual than before.
For instance, a data analyst processes monthly sales. This will be more efficient if the data contains not only revenue, but also the number of customers and the average bill. Visual data will allow the analyst to make the correct conclusion, and for the business to profit.
A DataFrame column is called a Series. Series works like a list, but looks like a column. Each element of the Series has a different index: 1, 2, 3, and so on. Index helps Pandas to act on each element in the Series to produce the final result.

If you multiply the data in Series by two, its length will not change, but the elements will double. Or, if you want to count the number of unique values in a column, Pandas will determine it by checking each element.

What can you do in Pandas
Analysts love Pandas for its benefits. Let’s break them down using a real-life example from a data analyst.
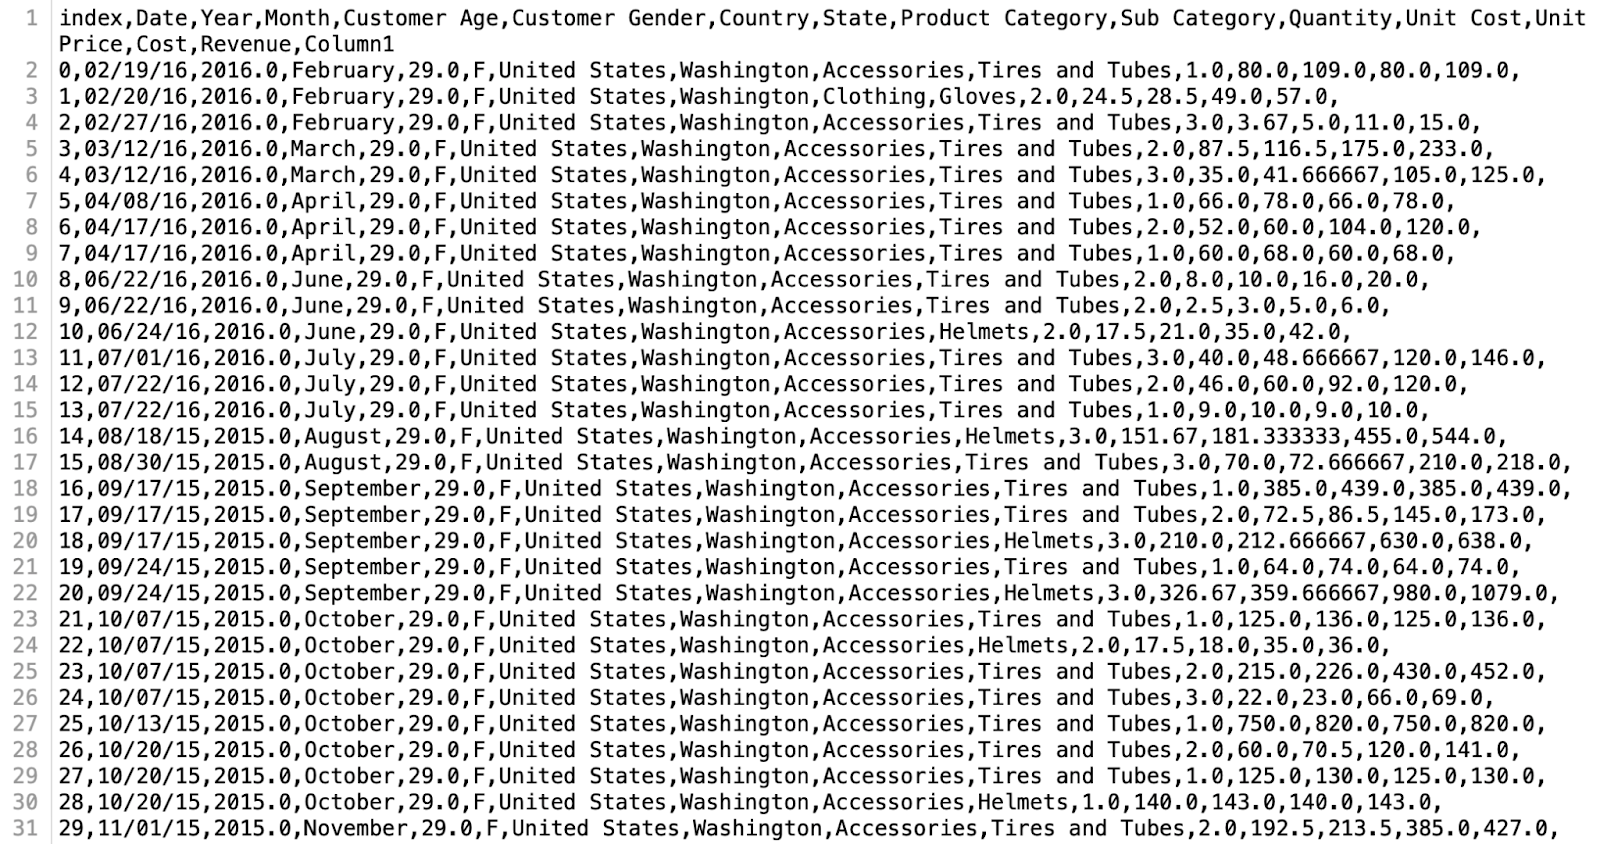
Imagine you’re analyzing Amazon sales. You have data pertaining to orders and customers for the 2015–2016 period.

When you open a file, Pandas will create columns with orders and customer information, so that you can assess the data scale and see what information is contained in each column.
Often a data analyst needs to select data by a single metric, for example, to locate orders of more than $100. This is easier to do when everything is laid out on the shelves. Or by Series.
Beyond that, you can calculate the number of orders made over the past month, or for the period from Q3 to Q4 2015, as well as total revenue by a certain date or per delivery, average receipt, conversation rate, and much more. In the same way, you can find the country whose customers will bring in the most revenue for Q2 2015.
Don’t be intimidated, you don’t have to be a math guru! It’s enough to make a simple one-line code request for Pandas to calculate everything itself.

As you can see, customers from the United States bring in the most revenue in Q2 2015. Good job! (One way or another, you will figure out the answer.)
Next, you need to share your conclusions about the data with the others in the company: they have to know what generates profit and what causes losses. The problem is, they won’t understand the DataFrame’s logic or your calculations — even if it looks nice!
Again, Pandas comes to the rescue. The library helps you visualize the data to make everything clearer.

Graphs, diagrams — you can present your findings in any format. A visualization will ensure the results of your important research are clear to anyone, including the courier who brings the order to your coworker.
How to master Pandas
Learning about Pandas can be difficult in the beginning. You can spend time reading the library documentation or watching videos. It’s pretty hard without a roadmap for learning and a mentor to assist you when you struggle with something completely new.
Data Analytics Bootcamp is on hand to keep you from getting confused and ease you into your new profession: it’s a seven-month part-time online program for beginners.
You do not need any tech background to enjoy learning on the interactive platform. Upon graduation, you’ll be well on your way to earning an average of $65,000 per year as a data analyst.
Putting what you’ve learned into practice is an effective way to master Pandas faster. You can do this in a fun way.
- Profitable App Profiles for the App Store and Google Play Markets. In this guided project, you will work as a data analyst for a company that builds mobile apps. You will use Pandas through practical data analysis.
- Analyze Your Own Netflix Data. This tutorial assists you in analyzing your data from using the video platform. No experience with Pandas is required. You can unload your Netflix data, prepare it for analysis, and easily see how much time you spend on your favorite show.
Wrapping up
Pandas is a powerful Python data analytics toolkit. It helps organize and structure data, calculate statistics, remove unusual values, which are called “outliers”, and find and visualize patterns.
That makes Pandas an indispensable tool of the modern data analyst and even data scientist. Knowing how to use it is, therefore, one of the most in-demand skills in their work.
Land a career in IT
With TripleTen you can become a data analyst in seven months. And you also get career coaching, which helps you find your first job in tech.
And if you don’t manage to find anything within six months of graduating, you get 100% of your tuition back.
TechStart podcast
Explore the realities of changing careers and getting into tech.
IT career tips
Sign up for our newsletter to get future-proof advice from tech industry experts.

.png)

.png)


